Basics:
The term Classification And Regression Tree (CART) analysis is an umbrella term used to refer two types of Decision Trees, used in data mining:
Regression Trees are more complex than Classification.
Decision tree learning is a method commonly used in data mining.The goal is to create a model that predicts the value of a target variable based on several input variables. This is achieved by Splitting the source dataset.
In mathematical form:
(x,Y)=(x1,x2,x3,...,xk,Y)
The dependent variable, Y, is the target variable that we are trying to understand, classify or generalize. The vector x is composed of the input variables, x1, x2, x3 etc., that are used for that task.
A tree can be "learned" by splitting the source set into subsets based on an attribute value test. This process is repeated on each derived subset in a recursive manner called recursive partitioning. The recursion is completed when the subset at a node has all the same value of the target variable, or when splitting no longer adds value to the predictions. This process of top-down induction of decision trees (TDIDT) is an example of a greedy algorithm, and it is by far the most common strategy for learning decision trees from data.
Consider the below source dataset having non-linear values or multiple (for e.g) two input variables (x1,x2).

To deduce the value on dependent variable (y), decision tree algorithm splits the data as mentioned above (I.e. Split till a particular area has same value of the target variable, or when splitting no longer adds value to the predictions).
Below will be it's Decision tree:
Code: Decision Tree Regression
# Importing the libraries
import numpy as np
import matplotlib.pyplot as plt
import pandas as pd
# Importing the dataset
dataset = pd.read_csv('Position_Salaries.csv')
X = dataset.iloc[:, 1:2].values
y = dataset.iloc[:, 2].values
# Splitting the dataset into the Training set and Test set is skipped due the dataset size is just 10 rows
"""from sklearn.cross_validation import train_test_split
X_train, X_test, y_train, y_test = train_test_split(X, y, test_size = 0.2, random_state = 0)"""
# Feature Scaling (Not Required here)
"""from sklearn.preprocessing import StandardScaler
sc_X = StandardScaler()
X_train = sc_X.fit_transform(X_train)
X_test = sc_X.transform(X_test)
sc_y = StandardScaler()
y_train = sc_y.fit_transform(y_train)"""
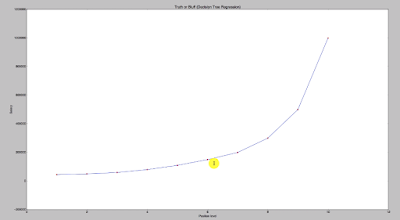
# Fitting Decision Tree Regression to the dataset (Fig 1)
from sklearn.tree import DecisionTreeRegressor
regressor = DecisionTreeRegressor(random_state = 0)
regressor.fit(X, y)
# Visualising the Decision Tree Regression results (higher resolution)
X_grid = np.arange(min(X), max(X), 0.01)
X_grid = X_grid.reshape((len(X_grid), 1))
# Re-Visualising the Decision Tree Regression results
plt.scatter(X, y, color = 'red')
plt.plot(X_grid, regressor.predict(X_grid), color = 'blue')
plt.title('Truth or Bluff (Decision Tree Regression)')
plt.xlabel('Position level')
plt.ylabel('Salary')
plt.show()
Hope this helps!!!
The term Classification And Regression Tree (CART) analysis is an umbrella term used to refer two types of Decision Trees, used in data mining:
- Classification tree analysis is when the predicted outcome is the class to which the data belongs.(Male/Female, Apple/Orange, Yes/No etc)
- Regression tree analysis is when the predicted outcome can be considered a real number (e.g. the price of a house, or a patient's length of stay in a hospital).
Regression Trees are more complex than Classification.
Decision tree learning is a method commonly used in data mining.The goal is to create a model that predicts the value of a target variable based on several input variables. This is achieved by Splitting the source dataset.
In mathematical form:
(x,Y)=(x1,x2,x3,...,xk,Y)
The dependent variable, Y, is the target variable that we are trying to understand, classify or generalize. The vector x is composed of the input variables, x1, x2, x3 etc., that are used for that task.
A tree can be "learned" by splitting the source set into subsets based on an attribute value test. This process is repeated on each derived subset in a recursive manner called recursive partitioning. The recursion is completed when the subset at a node has all the same value of the target variable, or when splitting no longer adds value to the predictions. This process of top-down induction of decision trees (TDIDT) is an example of a greedy algorithm, and it is by far the most common strategy for learning decision trees from data.
Consider the below source dataset having non-linear values or multiple (for e.g) two input variables (x1,x2).

Below will be it's Decision tree:
Now to predict value of Y, for any new point (x1,x2) lying in a particular split, you take average of all the points in a particular split and that average will be the value of Y, for that new point (x1,x2).
Example: Say X1:30 & X2: 50, Y will be 64.1, as the new points (x1,X2) lies in that split.
Code: Decision Tree Regression
# Importing the libraries
import numpy as np
import matplotlib.pyplot as plt
import pandas as pd
# Importing the dataset
dataset = pd.read_csv('Position_Salaries.csv')
X = dataset.iloc[:, 1:2].values
y = dataset.iloc[:, 2].values
# Splitting the dataset into the Training set and Test set is skipped due the dataset size is just 10 rows
"""from sklearn.cross_validation import train_test_split
X_train, X_test, y_train, y_test = train_test_split(X, y, test_size = 0.2, random_state = 0)"""
# Feature Scaling (Not Required here)
"""from sklearn.preprocessing import StandardScaler
sc_X = StandardScaler()
X_train = sc_X.fit_transform(X_train)
X_test = sc_X.transform(X_test)
sc_y = StandardScaler()
y_train = sc_y.fit_transform(y_train)"""
# Fitting Decision Tree Regression to the dataset (Fig 1)
from sklearn.tree import DecisionTreeRegressor
regressor = DecisionTreeRegressor(random_state = 0)
regressor.fit(X, y)
# Visualising the Decision Tree Regression results (higher resolution)
X_grid = np.arange(min(X), max(X), 0.01)
X_grid = X_grid.reshape((len(X_grid), 1))
# Re-Visualising the Decision Tree Regression results
plt.scatter(X, y, color = 'red')
plt.plot(X_grid, regressor.predict(X_grid), color = 'blue')
plt.title('Truth or Bluff (Decision Tree Regression)')
plt.xlabel('Position level')
plt.ylabel('Salary')
plt.show()
Hope this helps!!!
Arun Manglick


A decision tree is a visual model for decision making which represents consequences, including chance event outcomes, resource costs, and utility. It is also one way to display an algorithm that only contains conditional control statements. Making decision trees are super easy with a decision tree maker with free templates.
ReplyDelete